Meteorological Winter officially starts December 1st, but I am sick of waiting so let’s look into the upcoming Winter a little more closely! Weather nerds will enjoy this post, not all of you fall into that category so I have added headings, at the end will be a summary plus a look at the last half of November if you wish, scroll down to the end.
Before I start I wanted to share a conversation I recently had with Mrs. Weatherguy. Me: “I am so sick of this horrible weather.” Mrs. WG: “The weather is going to be horrible?” Me: “It IS horrible, and it is going to continue to be horrible for another week or so” Mrs. WG: “What do you mean there are no clouds, no wind and it is close to 60 degrees” Me: “I know isn’t it horrible?”
This conversation led me to look back at fall last year, was it this boring? What were we talking about at this time last year? Were conditions similar and if so does that mean we could be setting up for a similar winter to last year?
Last Year
October 2018 Temps

The last 30 days have looked like this

Not a match, but certainly very similar temperatures
ENSO (El Nino Southern Oscillation)
Last year we were approaching an El Nino event, but it was an El Nino Modoki (rhymes with Okey-dokey). A typical El Nino shows warming along the equator in the Pacific off the coast of South America. There are four regions that makeup El Nino: 1+2, 3, 3.4 and 4.

If the warming is more pronounced in the blue area above than the white and red areas it is a Modoki. Below is a good illustration of the difference.

Here are the current Sea Surface Temps.

Here is the forecast for the Sea Surface Temps in the El Nino region this year, this is measured as a blend of the temperatures in the 3.4 region. It is important to mention that there was still some disagreement at this time last year whether or not we would make it to an El Nino.
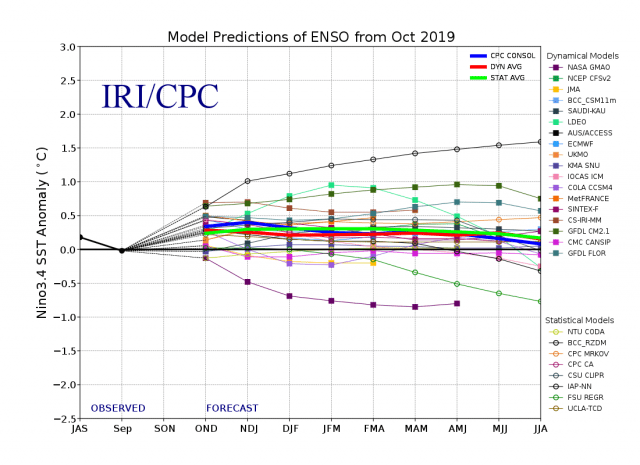
Every colored line is a forecast from a weather model. Everything above the .5 on the left is a forecast for an El Nino, everything below the -.5 on the left is a forecast for a La Nina. The letters on the bottom are three-month overlapping periods (SON=September, October, November etc.) The problem I have with the formal classification of an El Nino or La Nina is it has to occur for 5 of the 3 month overlapping periods in a row to be considered an El Nino or La Nina. You can experience El Nino or La Nina conditions without it meeting the several month criteria. Some of the snowiest winters here have been in Neutral or Modoki years. In this forecast, the majority of the models are between +.5 degrees and -.5 degrees. It will be very interesting to see the next ENSO forecast.
NOAA has been predicting an 85% chance of a neutral (La Nada) winter. However, in the latest update this week it is starting to show Modoki conditions developing. The warmer temperatures are located further west in the 3.4 region and into the 4.0 Nino region.

In the illustration above the Modoki region is in yellow.
Wait It Gets More Complicated
It sure would be nice if that was all we have to take into consideration, but as I have said ENSO status is a very simplistic way to predict what will happen in the Winter. Of course, El Nino and La Nina are the most recognized of all climate modes so they are the most hyped by the media, in reality they are a very small piece of the puzzle. There are many other climate modes you have to take into consideration. the North Atlantic Oscillation (NAO), the Arctic Oscillation (AO) and Antarctic Oscillation (AAO), the Pacific North American Oscillation (PNA) pattern, the Eastern Pacific Oscillation (EPO), the Western Pacific Oscillation (WPO) and the Indian Ocean Dipole (IOD). All of these factors have a positive, neutral, and negative phase (just like El Nino is a positive status and La Nina is negative status) and they all feedback into the MJO (Madden Julian Oscillation).
The MJO
It is time once again for me to talk a bit about the Madden-Julian Oscillation or the “MJO” as forecasters like to refer to it. The Madden-Julian Oscillation is a tropical disturbance that moves clouds, winds, precipitation, and pressure changes eastward around the global tropics about every 30-60 days. Typically, in the Northern Hemisphere the late fall, winter, and early spring have the greatest level of MJO activity.
There are phases in the MJO cycle and models predict where the cycle is headed generally 14 days in advance. Below is the MJO forecast. The numbers 1 through 8 correspond to the 8 phases of the MJO cycle. The red and purple lines are the past, the green line with black dots is the forecast for the future. The black dots on the green line are days You literally have to count the dots on the green line because only the past dates are listed (on the purple and red).
Last year I did an in-depth post on the MJO, this was the forecast for November 24th to December 8th (2018) from the GFS.

At the time we were transitioning from phase 6 into phase 7 (don’t worry I’ll explain the phases in a minute, I have charts!). I mentioned amplitude earlier, anything close to or in that circle means the MJO will have very little effect on the weather. I labeled that “Null”. The further you go outside the circle the more the MJO affects our weather. I labeled those “Moderate Amplitude” and “High Amplitude”. By counting the dots on the green line you will see we are forecasted to go into a moderate phase 8 around 11/29 and into a moderate phase 1 December 3rd. The red line is the past, you can see that at that time we had been in phases 3,4,5,6 for the last 18 days.
I specifically used last years MJO forecast at the time so that I could contrast that with the current MJO forecasts from the Euro and the GFS
GFS

Here is the Euro MJO forecast

Not only are they similar to each other, but they are also similar to late last November. Once again we are transitioning from phase 6 to phase 7 after a couple of weeks in 3, 4, and 5, we are then forecasted to go into phase 8 and 1, so what does that mean?
The Phases change depending on what months we are in, so phase 7 in one month can be completely different than phase 7 in another month. As you can see from a temperature perspective phases 8, 1 & 2 are colder and generally stormier phases for us.

Remember as I said the lower amplitude of the phase we are in the lower the impact of the MJO on our weather. Also, the shorter amount of time that is spent in a particular phase the lower the impact. Going back to the forecast we are expected to zip right through phases 6 and 7, get about halfway through 8 then things start backing up and slowing down this occurs around 11/15/19 according to both of these models.
So let’s look at what happens as we get into next weekend according to the models. Fast forward to Friday through Monday.
GFS

Euro

Good News And Bad News
The good news is these forecasts team up well with the corresponding operational models, the bad news is the models can be wrong so while it is encouraging to see the models agree with not only themselves but also with each other, it is still too early to be sure. The best thing to take from this is how the MJO and all of the teleconnections (PNA AO, NAO, EPO, WPO) feedback into the MJO which can have an effect on our weather halfway around the earth. The other thing that is interesting to me is how similar the MJO phases we are in this year are to last year.
Other Factors
Other important factors are the Pacific Decadal Oscillation (PDO), the Atlantic Multi-Decadal Oscillation (AMO) and the Quasi-Biennial Oscillation (QBO) which can affect Stratospheric warming (Polar Vortex outbreaks). These factors, as well as some of the other teleconnections I mentioned above, also correlate with one of the biggest drivers of weather going back to the beginning, the Sun.

Since 1849, there have been 114 years (including 2019) with at least 1 spotless day. The chart above shows the 25 years with the highest number of spotless days. 1913 is record holder with a staggering 311 days, while 2008 ranks fourth in years with a spotless sun (265 days). With 262 days, 2009 falls just short of 2008 but it still makes it in the top 5 of years with most blanc suns, testifying of the deep minimum prior to the onset of SC24. Last year in 2018 there were 208 days (green bar) which put it into the top 25 years with most spotless days. It’s currently ranking 15th place, well behind 2008 and 2009.
2019 is on track to be the period of the lowest solar activity since 2009. So far this year we have had 234/313 days without sunspots. This year could very well put us in the top five for low solar activity. It is easy to draw conclusions that low solar means heavy snow especially when you see 2008-09, 2009-10 and 2018-19 years which were all memorable in this area but on its own, there is no direct conclusion that can be made, what you can conclude is that it affects all of the other factors that can drive our winter.
Analog Years
When forecasters are brave enough to attempt to put out a Winter Forecast they start by going back to the past, they take into consideration all of the present and recent factors in the current state of the weather, then they compare those to similar conditions in the past, they then look at what occurred during those years and weight the significance of those events to try to forecast the upcoming winter. Those years that they identify are called Analog years. Last year we had some fun early season looking at the analog years and what is ironic is that the analog years I kept hearing from forecasters were some notable years of high snow accumulation for our area. It was because of the years listed that I came out and said I thought there would be a good chance of slightly above average snowfall for our area. Of course, no one, and I mean no one late last fall anticipated that it would be the wettest winter in recorded history for the US as a whole.
Before I get to the analog years I want to state an opinion, the majority of the Companies and individuals who issue these winter forecasts tend to focus on the east coast. I get it, that is where the population centers are, but I do think whether they realize it or not they come up with some of these analogs based on what happened those years in the east, not necessarily the west. Last year most forecasters were sure the SE US was going to have an unusually severe winter and the storm path would direct those storms up to the NE. They also expected a dominant trough in the eastern US. Neither of those things happened.
With all of that being said here are the analog years I am hearing for the upcoming winter. From one source I follow 1962-1963, 2004-2005, 2013-2014, 2014-2015 and 2018-2019. Yes 2018-2019, and guess what? He is double weighting 62-63 and 2018-19 in his forecast, because of the low solar activity. Overall, he is calling for very slightly above average temps and average precipitation for our area. Another company I follow is using the following years as analogs 61-62, 83-84, 2002-2003, 2012-2013, 2013-2014, 2014-2015 and yep 2018-2019.
I have devised a way to score each of these years to correspond snowfall potential, soley based on analogs.
AVG= Average (0), A=Above(+1), WA=Well Above(+2), B=Below (-1), WB= Well Below(-2)

Using the same methodology (that I made up) let’s take a look at the analogs that were used for last year.

Summary and a look ahead
As I mentioned in the MJO discussion there is a chance of some precipitation next weekend. I will be tracking it, but we are in a very nasty pattern right now, a chance is better than no chance, but it is going to take a lot to break down that ridge over the west coast, if we can weaken it bit by bit we may see that ridge allow a few systems to come underneath. Last year was pretty depressing around this time of year, our first advisory in for the mountains last November came right before Thanksgiving, and the storm did not pan out as well as had hoped. A series of systems from the NW came in December which loaded up the Central and Northern Mountains with snow, mostly missing us. Our first big break came just before New Years and as we all know it got completely ridiculous after that, then we took a break from snow from January 20th through February 5th, then it got ridiculous again. Nobody expected how much snow we got in January and February, nobody.
A number of factors will influence our winter once again this year, if you skipped over the other sections to get to the end, you may want to glance through when you have more time for a better explanation. I have concerns about a number of the analogs being used by forecasters this year, on one end of the spectrum you have 2013-2014 and 2002-2003 among others which were horrible snow years, in the last month one season has recently been added to analogs by many and that is last year, 2018-2019, in some cases it is being given double emphasis. Which gives me hope of at least an average year for snowfall. However, if I were pressed right now I would guess that we will have average to slightly below average snowfall this year from Purgatory south. Below-average snow south of 160 and slightly above average snow for Telluride, Silverton, Pagosa and Wolf Creek. This could all change in the coming 4 to 6 weeks for me but that is what I see now.
I am very much looking forward to keeping you updated this winter and if I get the support from donors like I did last winter I have plans to add some data suppliers and a few other fun things to enhance the overall experience of the site. Thanks for following and for your continued support.
Click here to donate
Click here to contact me